I led a team that created a bespoke, innovative and accessible database, displaying live project information alongside office analytics, with comparisons across global sites
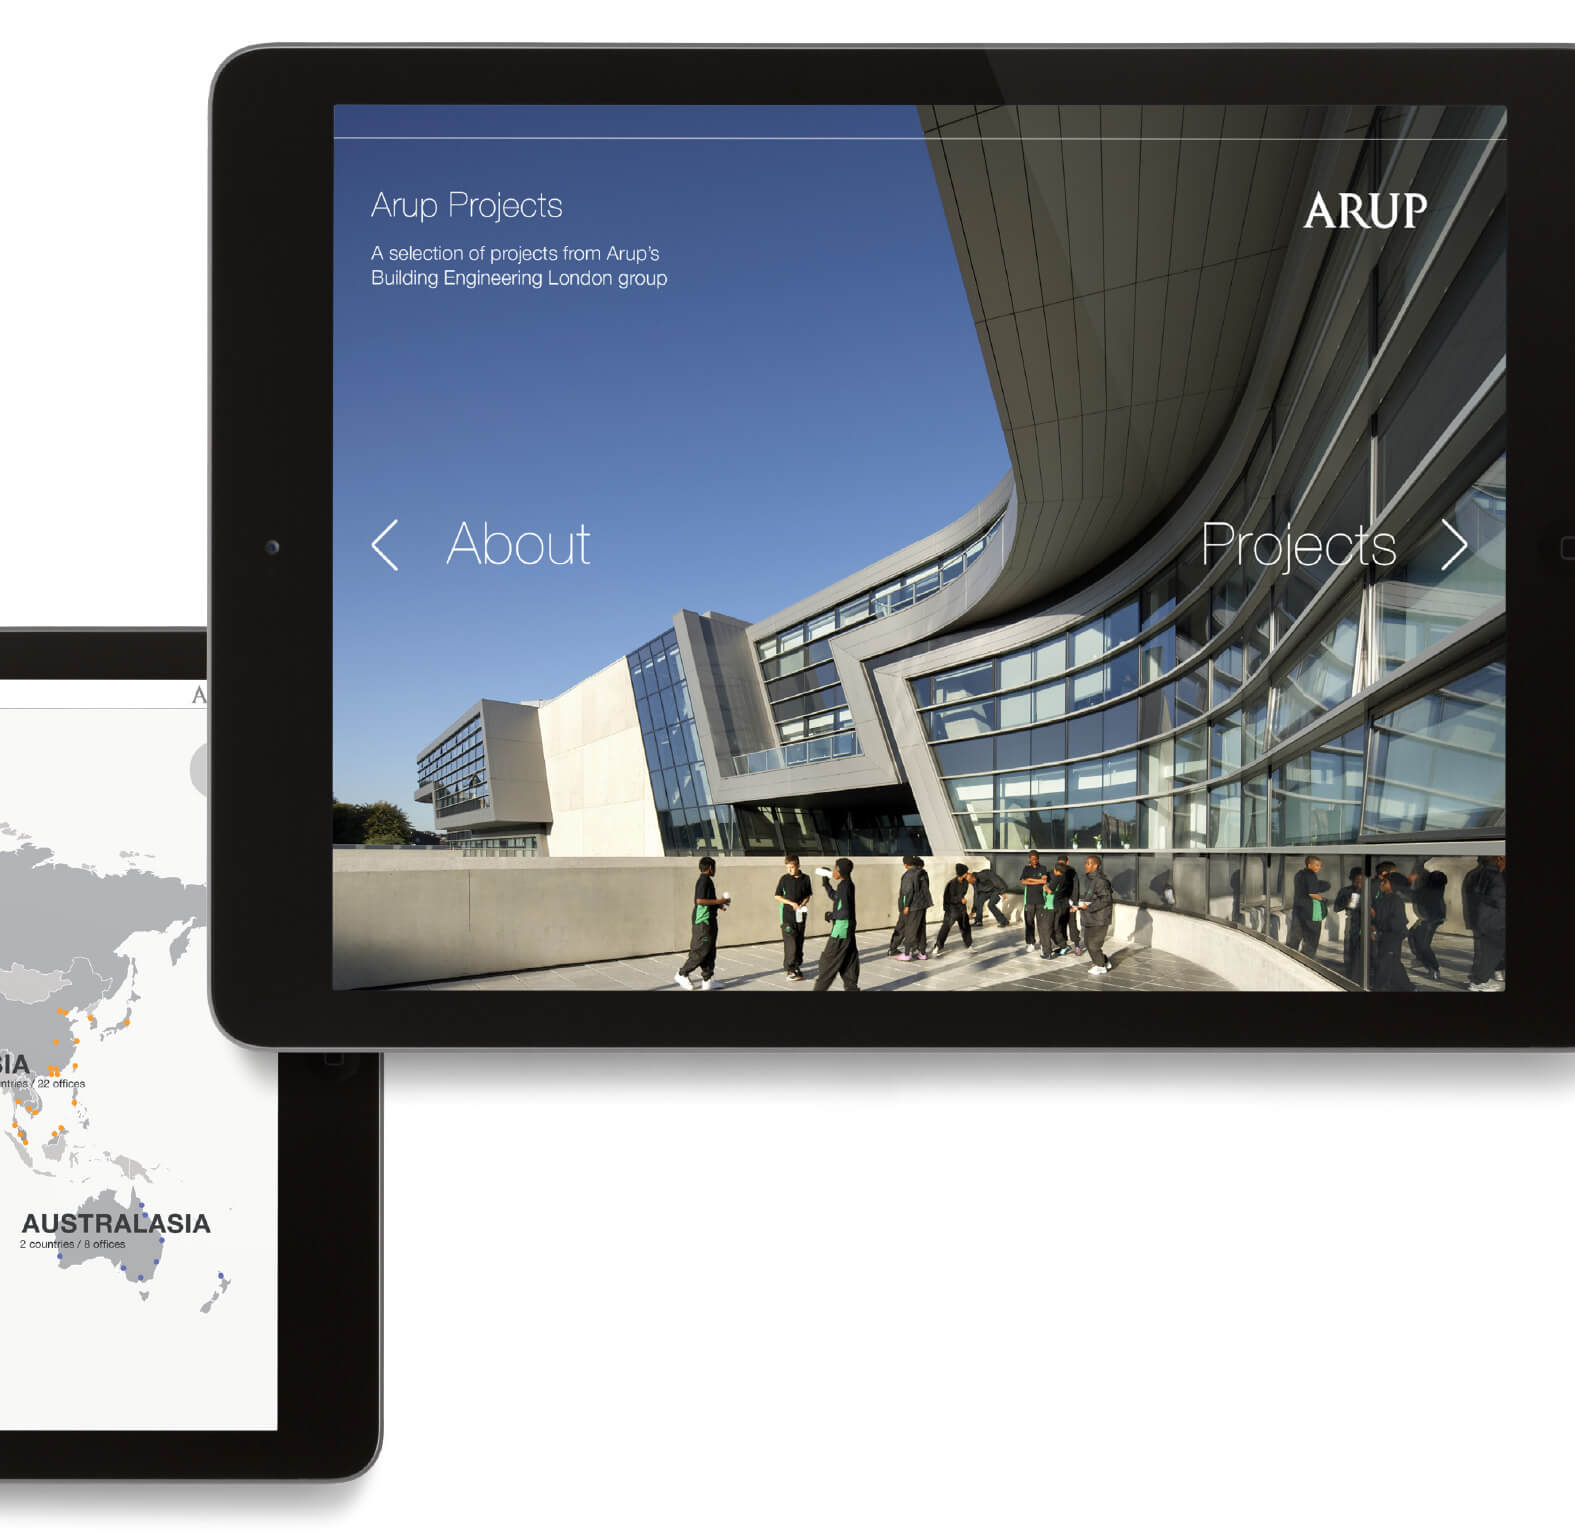
As UX lead and project manager, I fulfilled the aim of developing a stronger relationship with GSAs by building a sleek and easy to use client-facing portal. We updated the original antiquated system to present information to any user at the touch-of-a-button.
01.
Goals & Challenges
By providing a better experience for our GSAs through their adoption of the portal, we put Unispace at the forefront of innovation and achieved our main goal of enhancing our reputation and relationship with them.
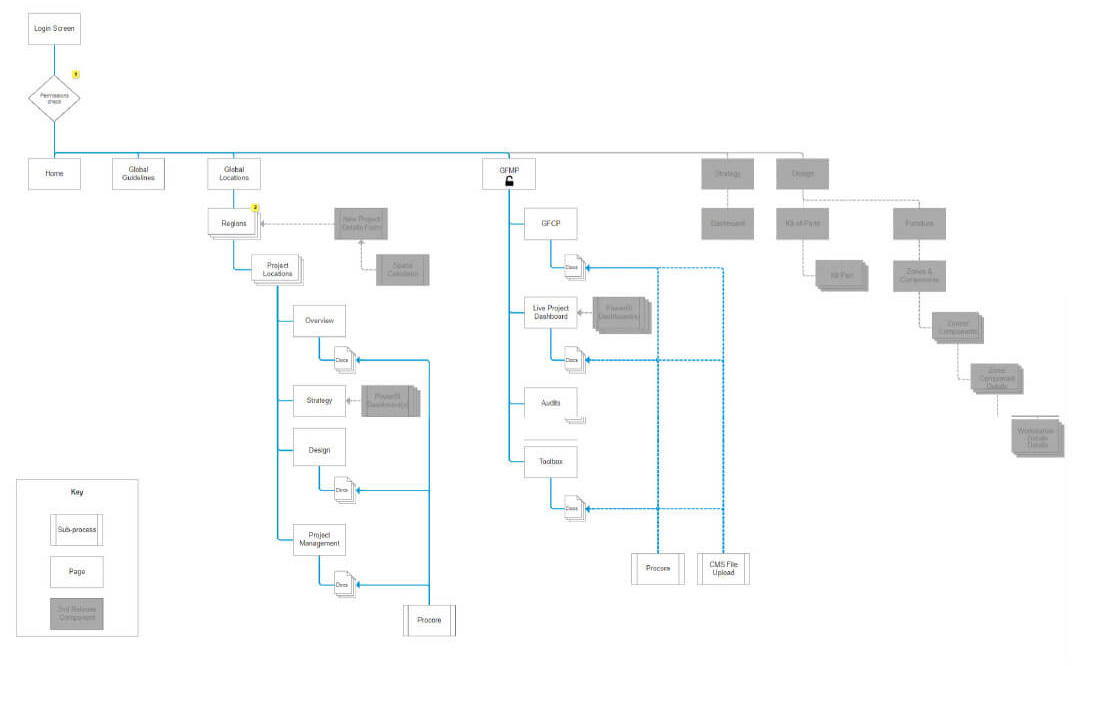
Providing a rich UX experience with efficiency and functionality for 122 sites was no mean feat. The use of information architecture was crucial as one of the goals of the portal was to be repurposable for other projects.
-
Our high-level goals were as following:
- Elevate the relationship with clients by creating a unique and emblematic offering to our GSAs
- Create a repurposable framework for use on other projects
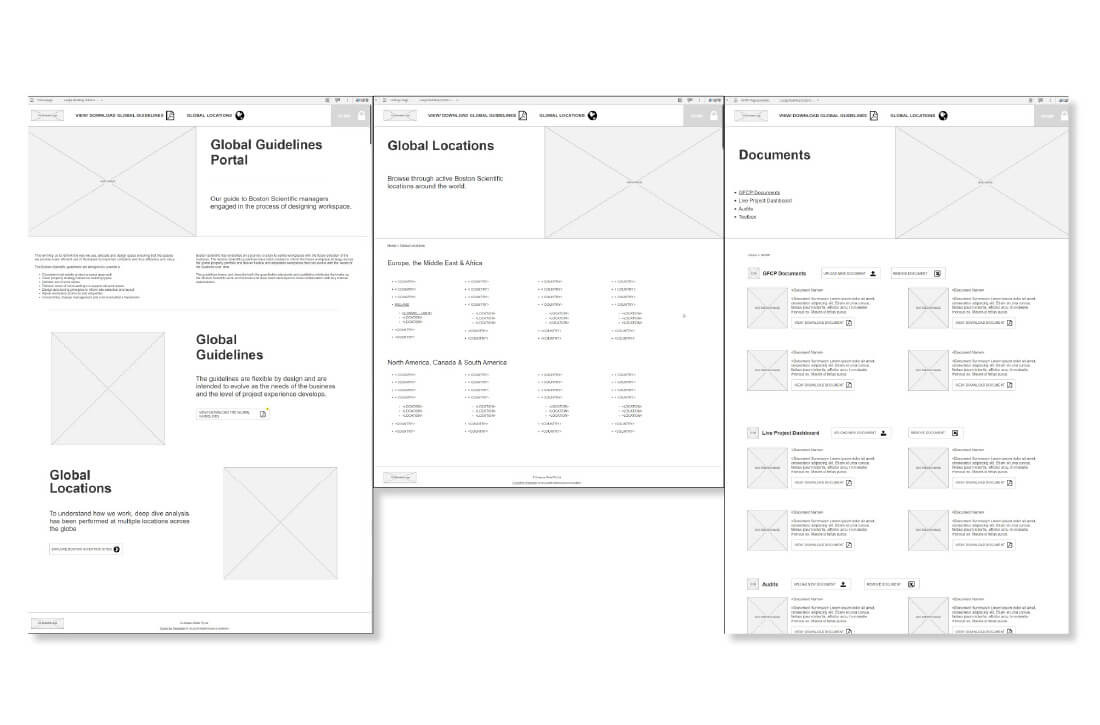
Wireframe mockups
02.
Research
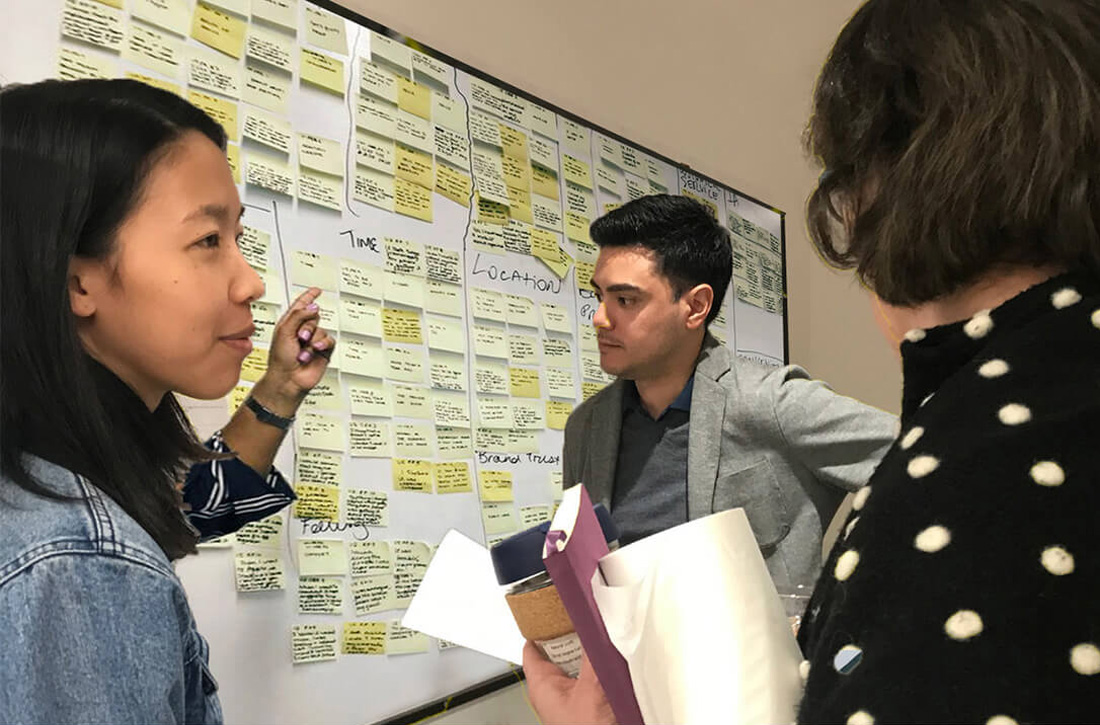
We began by working with stakeholders and project sponsors from Unispace and the client's property department. Working with teams across the globe meant using virtual platforms and managing time-differences. We had to use an APi to keep the new system in sync as the pre-existing ProCore system was too technical, with little effective curation. Through interviews, personas and user-testing, we were able to establish data sources and security requirements. Multiple layers of security and access were important due to the sensitive nature of the information. We also deployed strong encryption and login systems.
We mapped user journeys to create efficient information architecture and clear user-flows for the extensive content. Creating affinity diagrams and illustrated storyboards to display a user journey helped navigation between sites.
Affinity mapping the portals functionality
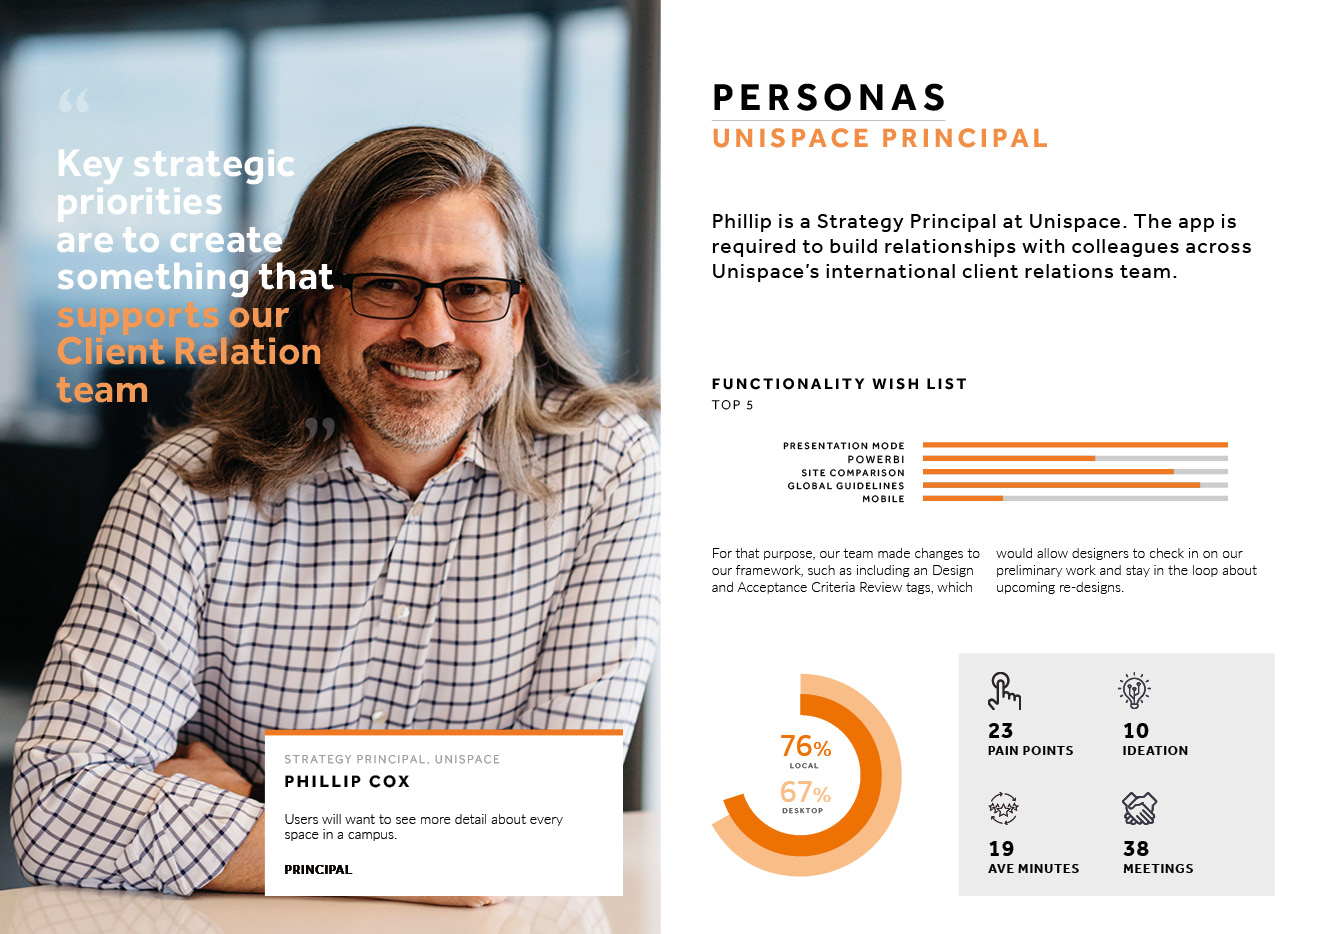
Personas
User journey map
03.
Design Process
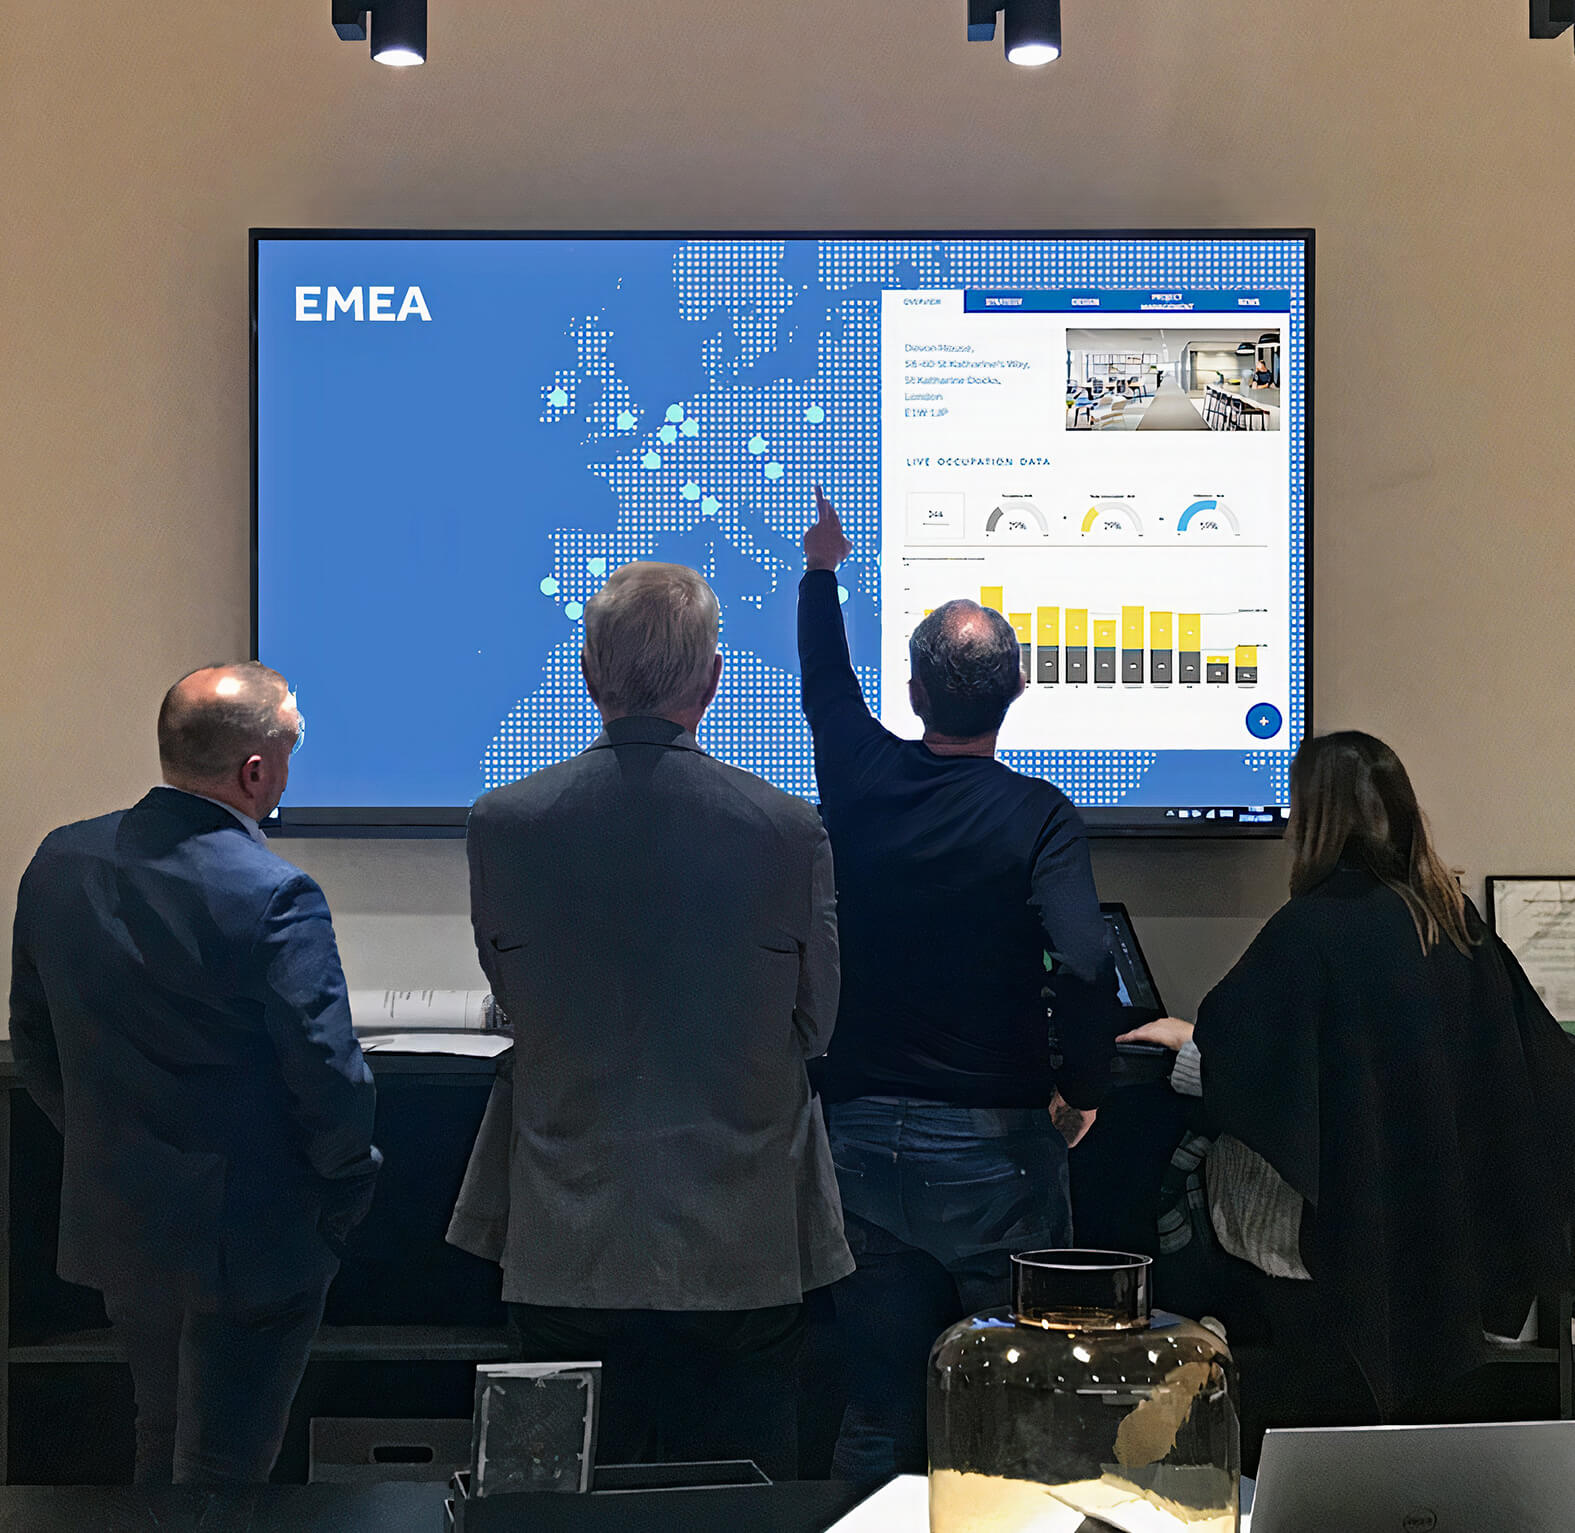
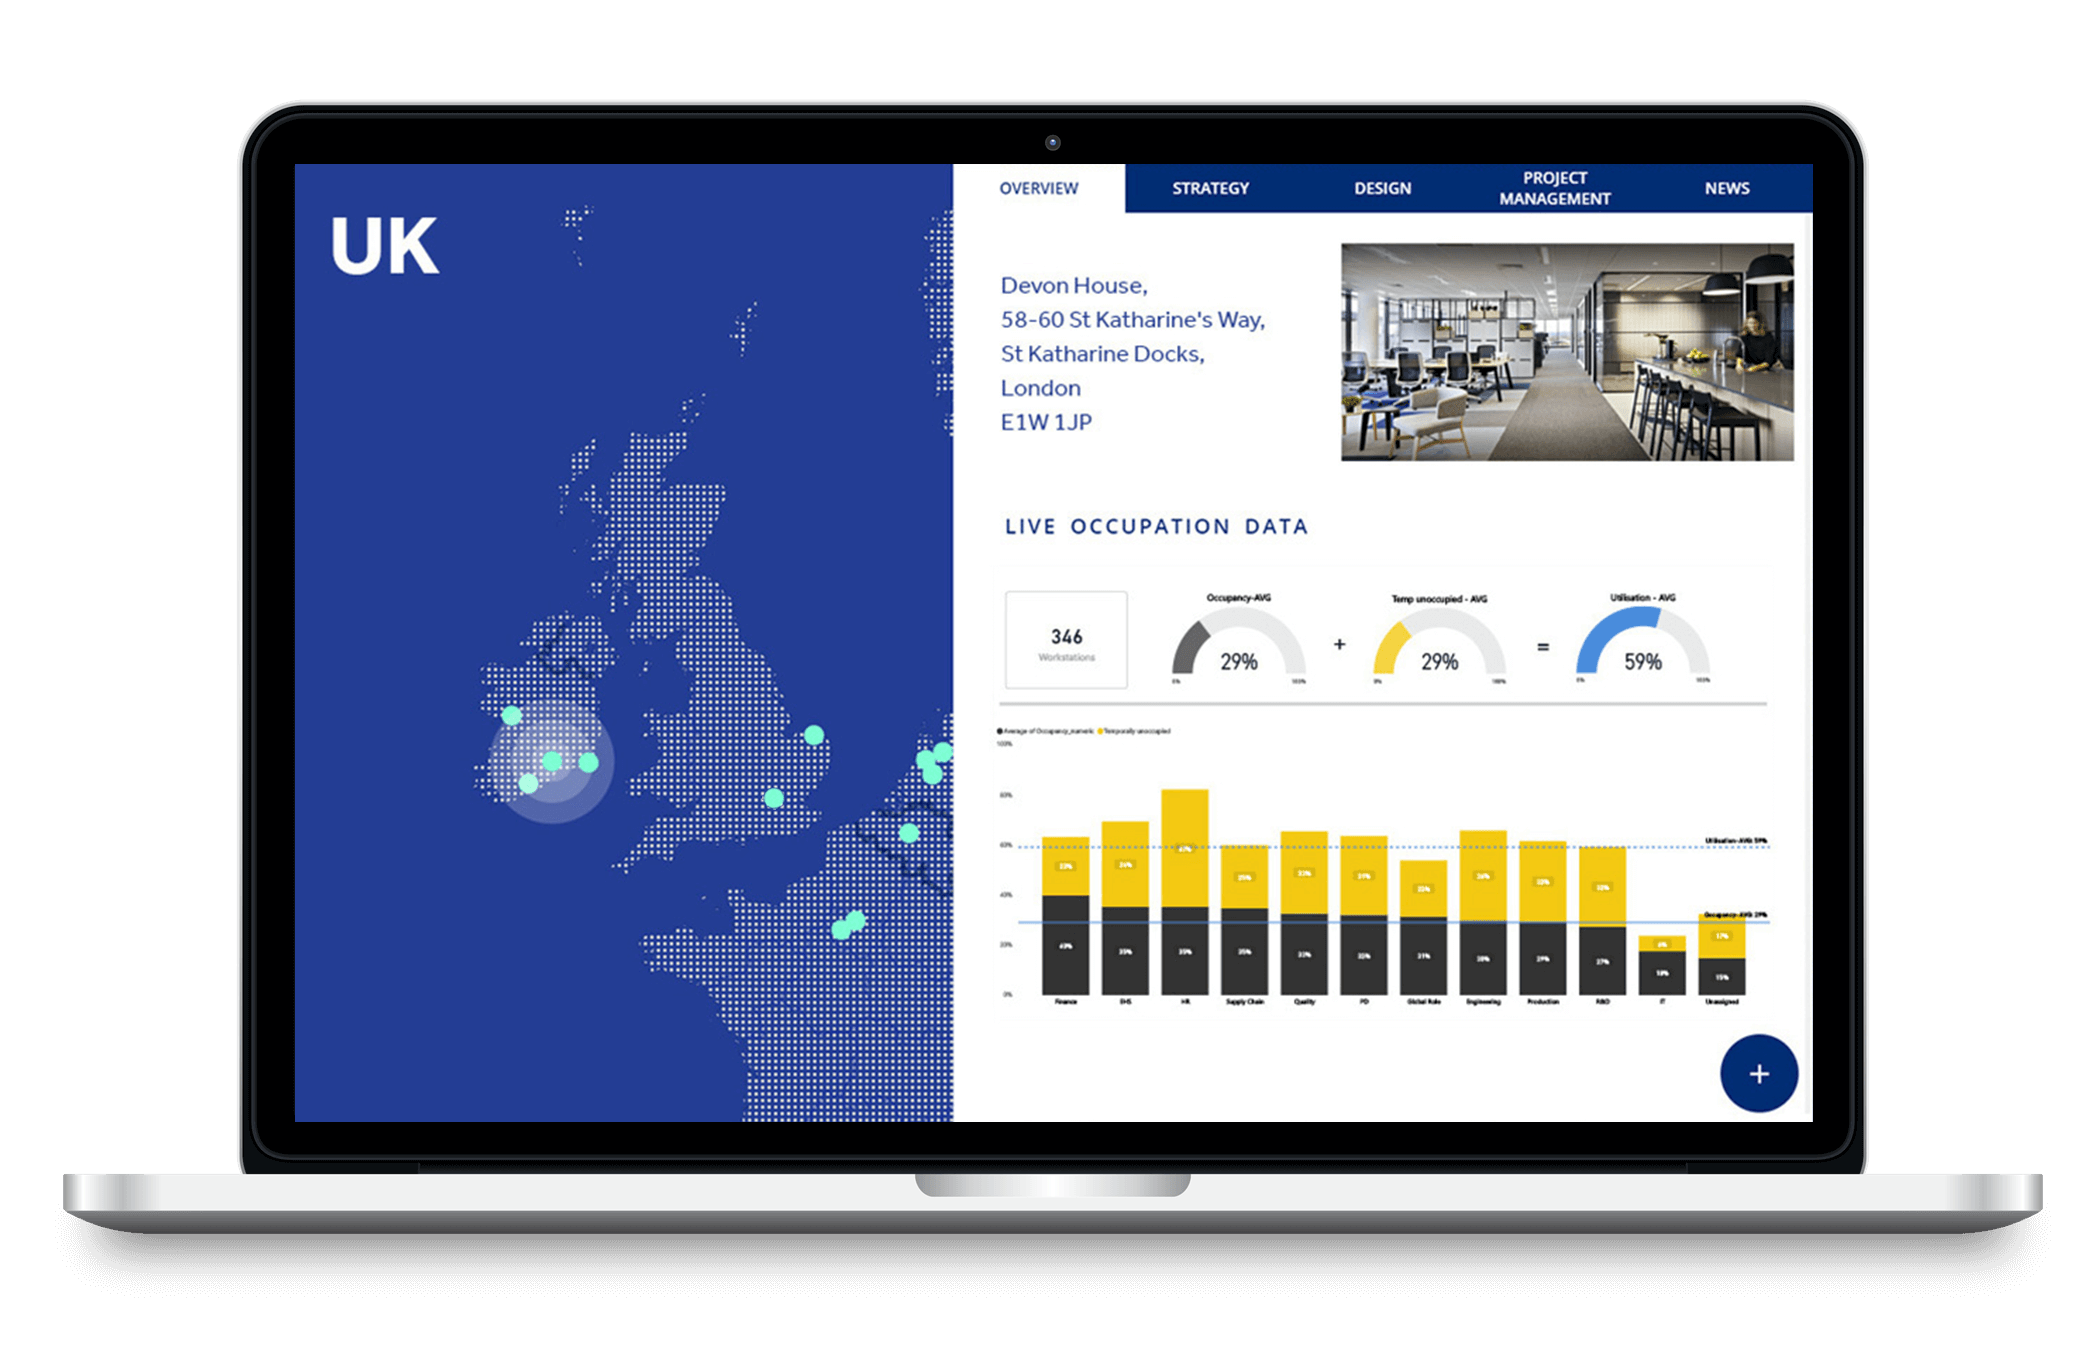
In response to research, I built a roadmap of important features the app should have. We collected pain points and tested different scenarios to prepare for all eventualities. One of our many successes in this area was allowing users to navigate geographically. This came as a result of comparisons with other less dynamic methods such as lists. The addition of a map made the experience far more intuitive, immersive and accessible.
The interactive map enables users to be seamlessly guided through and around the space, navigate between different sites, access design strategy and live data content and position themselves at the forefront of the project. Using MapBox enabled us to sync projects using an APi, dynamically controlling positions, as well as editing the look and feel of the map to sync with the overall look and feel of the site. It also allowed us to add data to hover stats, giving the user an efficient way to see high level stats. MapBox also allowed us to add very low poly versions of 3D models for each site, making the network of sites come alive. To access documents, projects were navigated using the map, and document types were organised into separate categories such as Design, Strategy, Project Management.
Linking with PowerBI, we devised a secure way to release using a RestAPI so that the security of the data was uncompromised. Working with strategists, we developed PowerBI dashboards that allowed the client to make comparative analysis of sites based upon sensor data and other recorded metrics. Creating a mechanism to allow the client to submit potential project requests also meant Unispace being better able to anticipate new business opportunities.
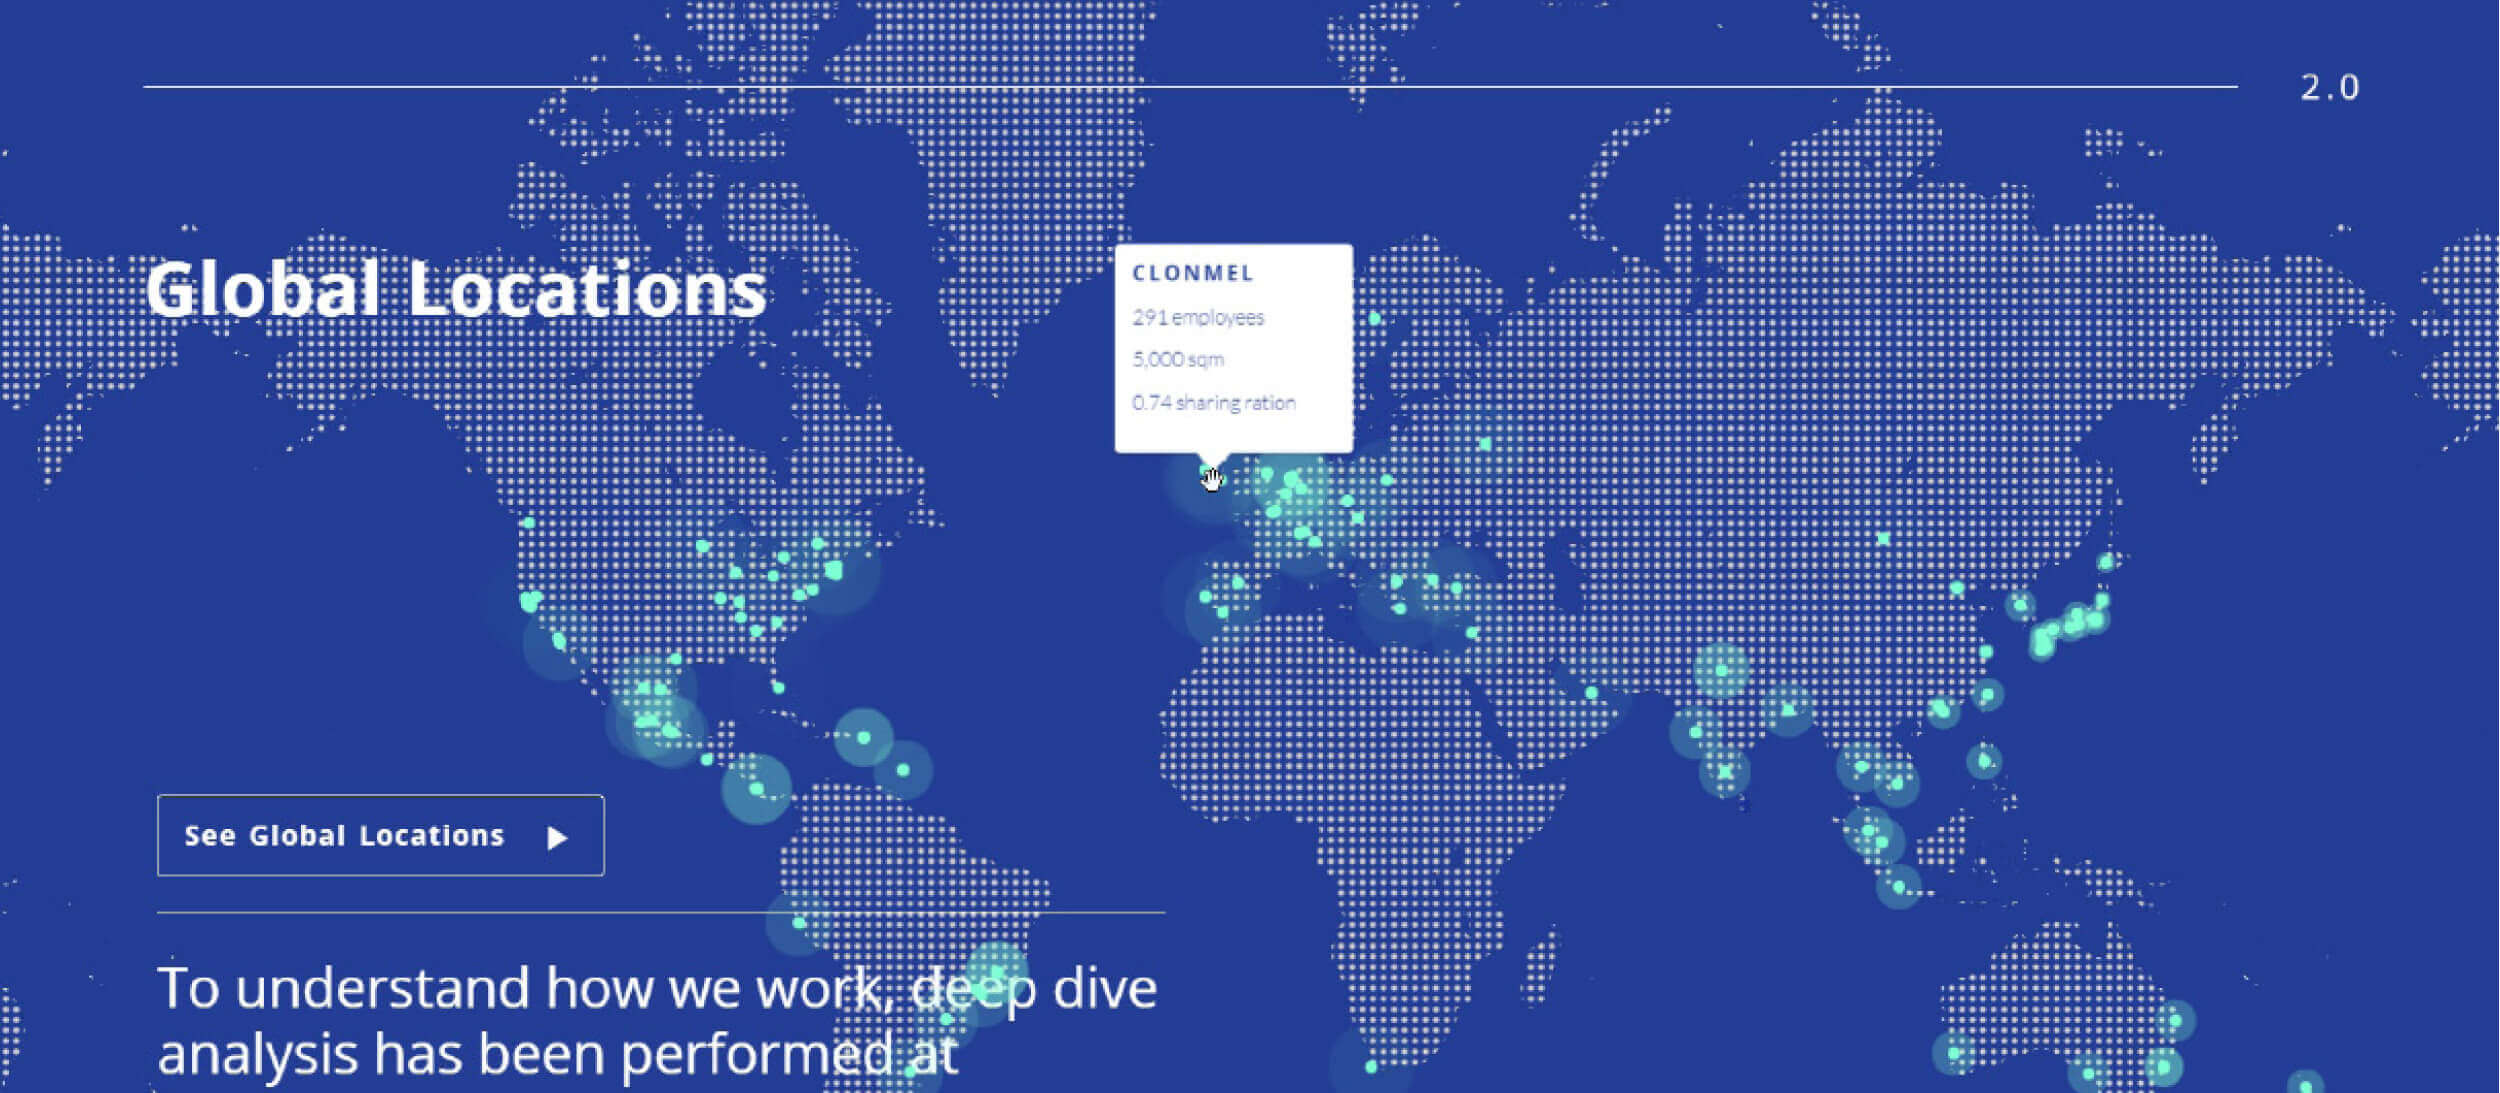
Interactive map with site analytics
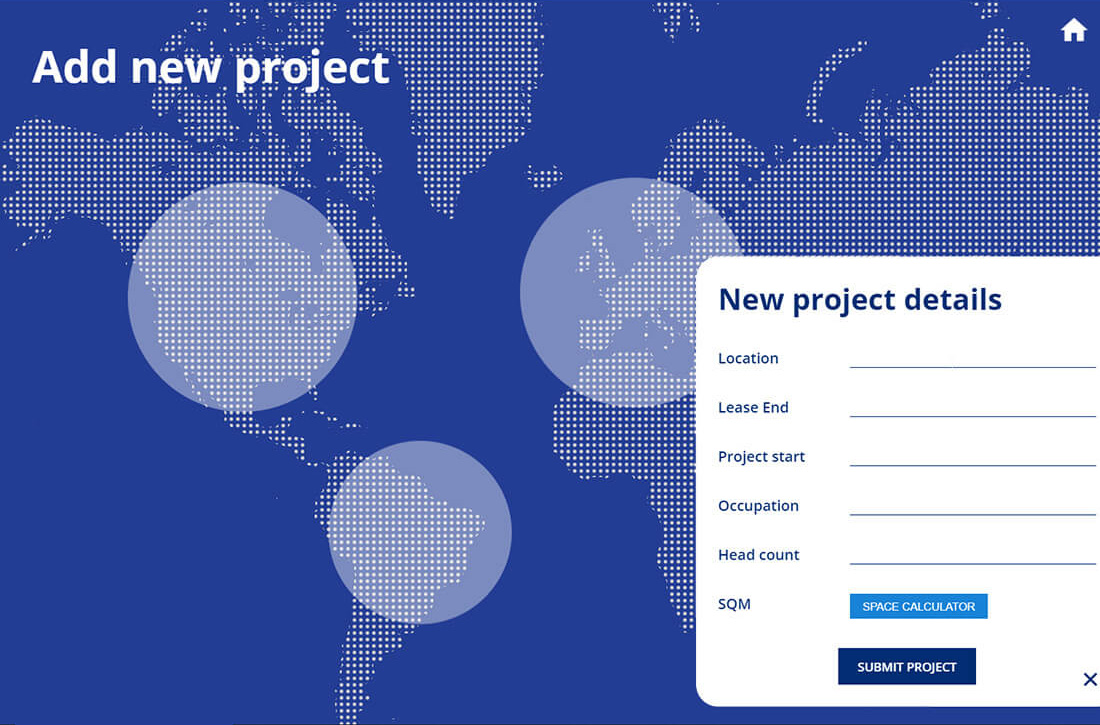
Enabling the client to add new project proposals
04.
Results
Impacted by COVID-19 the project was restructured and delivered in phases, with the first phase being a more simplified, functional delivery; and the second phase to be deployed in due course.